

esCCO
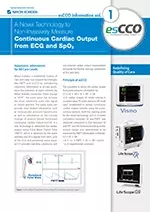
The next generation of non-invasive hemodynamics monitoring
Redefine Quality of Care with esCCO
Nihon Kohden is redefining Quality of Care with an innovative technology—esCCO (estimated Continuous Cardiac Output), by introducing volumetric information to all care levels despite the level of invasiveness.
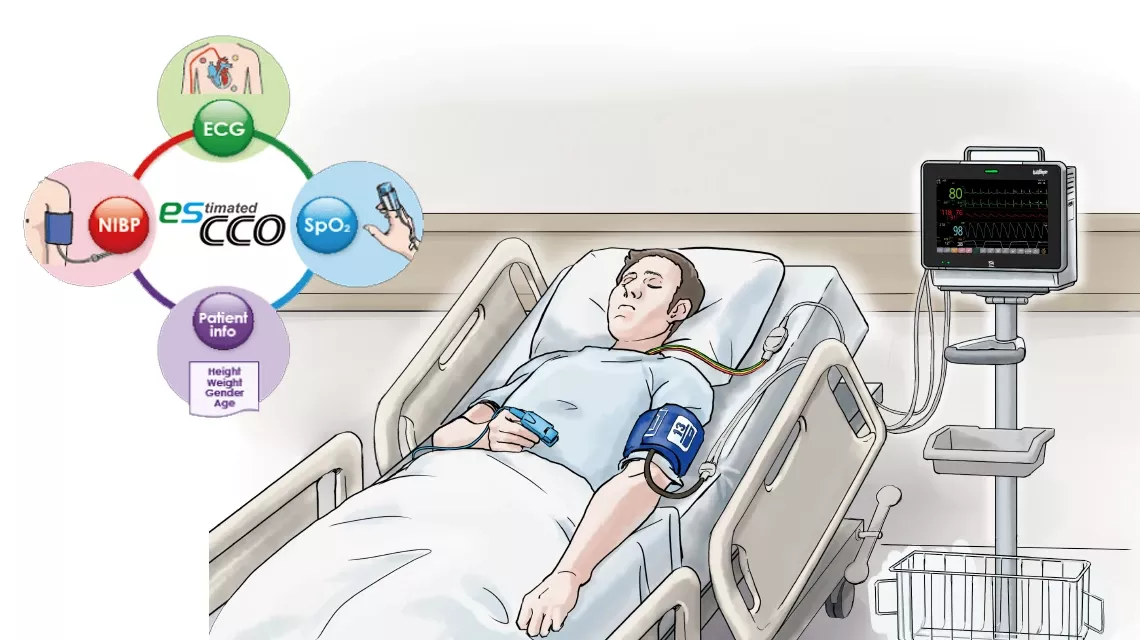
esCCO is a new technology to determine the cardiac output using Pulse Wave Transit Time (PWTT) which is obtained from the pulse oximetry and ECG signals.
The trending performance of esCCO to track changes in cardiac output and stroke volume has been evaluated in clinical studies and its accuracy has been shown to be relevant for clinical use1, 2.
Because esCCO calculates CO using standard measurement parameters, it does not require special techniques or special consumables. With esCCO, it is possible to provide optimal hemodynamic management to patients who could not be measured using CO due to cost or shortage of human resources.
Reliable trending performance
Easy
No additional sensors
esCCO for fluid optimization
It has been reported that optimal fluid management based on volumetric parameters such as stroke volume and cardiac index could improve patient outcome including shorten length of stay and reduced complication rate3, 4. So now, there is a growing demand for less invasive and more efficient method for managing hemodynamic trends for better patient care. Non-invasive and easy-to-use esCCO can provide a useful solution for this purpose by making up for the shortcomings of other method currently available in the market.
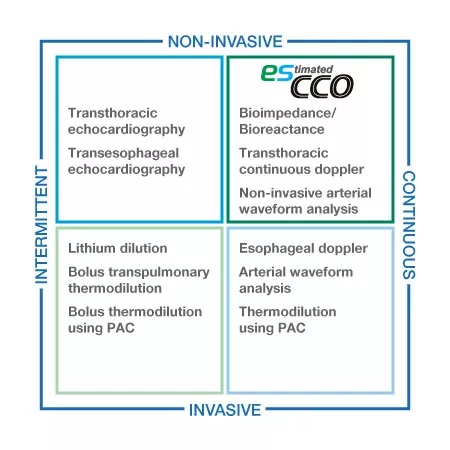
Volumetric information for all care levels
esCCO provides cardiac output information only using common vital sign parameters of ECG, SpO2 and blood pressure, requiring no additional sensors or special trainings. Hemodynamic trend monitoring will be available with esCCO for all care levels, not only during major surgeries but also in lower-risk procedures for high-risk patients showing a higher chance of bleeding or any hemodynamic stress. Also, esCCO can be a reliable index during fluid administration in various clinical settings. Adding esCCO to the conventional patient monitoring may lead to optimization of fluid management, decreased risk of complications and eventually to better outcome including reduced length of stay.
Potential applications of esCCO
esCCO can provide volumetric information for more comprehensive and continuous hemodynamic trend monitoring, improving the quality of patient care and clinical outcomes.
Hemodynamic monitoring after pulmonary artery or transpulmonary thermodilution catheter removal.
Hemodynamic optimization of patients who are ineligible for more aggressive and risky techniques (i.e. pulmonary artery catheter)
Support in the decision-making process for goal-directed fluid management and more.
Triage tool for early detection of sudden deterioration.
1 Ishihara H, Okawa H, Tanabe K, Tsubo T, Sugo Y, Akiyama T, Takeda S. A New Non-Invasive Continuous Cardiac Output Trend Solely Utilizing Routine Cardiovascular Monitors. J Clin Monit Comput 2004; 18: 313–320.
2 Yamada T, Tsutsui M, Sugo Y, Sato T, Akazawa T, Sato N, Yamashita K, Ishihara H, Takeda J. Multicenter Study Verifying a Method of Noninvasive Continuous Cardiac Output Measurement Using Pulse Wave Transit Time: A Comparison with Intermittent Bolus Thermodilution Cardiac Output. Anesth Analg. 2012 Mar 30
3 Wakeling HG et al. Intraoperative oesophageal Doppler guided fluid management shortens postoperative hospital stay after major bowel surgery. Br J Anaesth 2005; 95 : 634-42.
4 Mayer J et al. Goal-directed intraoperative therapy based on autocalibrated arterial pressure waveform analysis reduces hospital stay in high-risk surgical patients: a randomized, controlled trial. Crit Care 2010; 14: R18.
Principle of esCCO
Pulse Wave Transit Time as an Essential Technology for esCCO
Pulse Wave Transit Time, PWTT, is defined as the time from the ECG R-wave peak to the pulse wave rise point. The pulse wave rise point is defined as the point where the differentiated pulse wave reaches 30% of its peak amplitude1. PWTT consists of three intervals: pre-ejection period (PEP), pulse wave transit time through elastic artery (T1), and pulse wave transit time through peripheral arteries (T2) (Figure 1).

PEP reflects cardiac contractility and preload and shortens as cardiac contractility and preload increase.
T1 depend on arterial compliance, and it shortens when blood pressure increases. T2 reflects vascular resistance as blood vessel dilates. Thus, based on the various elements of hemodynamic management included in the PWTT, combined with physiological findings related to cardiac output (CO), we have been validating its clinical application.
As a result, an initial attempt was made to infer blood pressure from PWTT. However, it became clear that changes in PWTT were different when cardiovascular agonist drugs were administered.
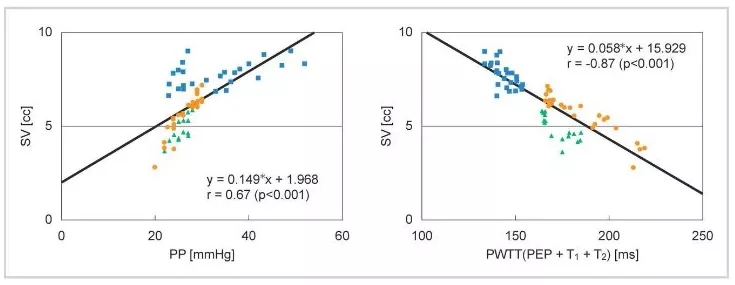
It was observed that PWTT and stroke volume (SV) show a good correlation even when changes in blood pressure and SV do not coincide during drug administration (Figure 2).
Formula of esCCO
Most existing devices for cardiac output measurement use the pulse contour method, which calculates output from the arterial blood pressure waveform, as the measurement principle. This shows that there is a good correlation between stroke volume (SV) and pulse pressure (PP) (Equation (1)).
SV = K × PP (1) K: a constant
Also, in the basic concept of esCCO, PWTT and SV in Figure 2 are in good correlation, which can be shown as equation (2).
SV = α’ × PWTT + β’ (2) α’: a constant β’: a coefficient
Equation (2) can be expanded to equation (3) by using equation (1) to include the compliance component K.
SV= K × ( α × PWTT + β ) (3) α: a constant, β and K: coefficients
Based on the above, the cardiac output is continuously measured using PWTT, and esCCOis obtained using equation (4).
CO = SV × HR = K × (α × PWTT + β) × HR = esCCO (4)
α: a constant, β and K: coefficients (4)
Calibration of esCCO
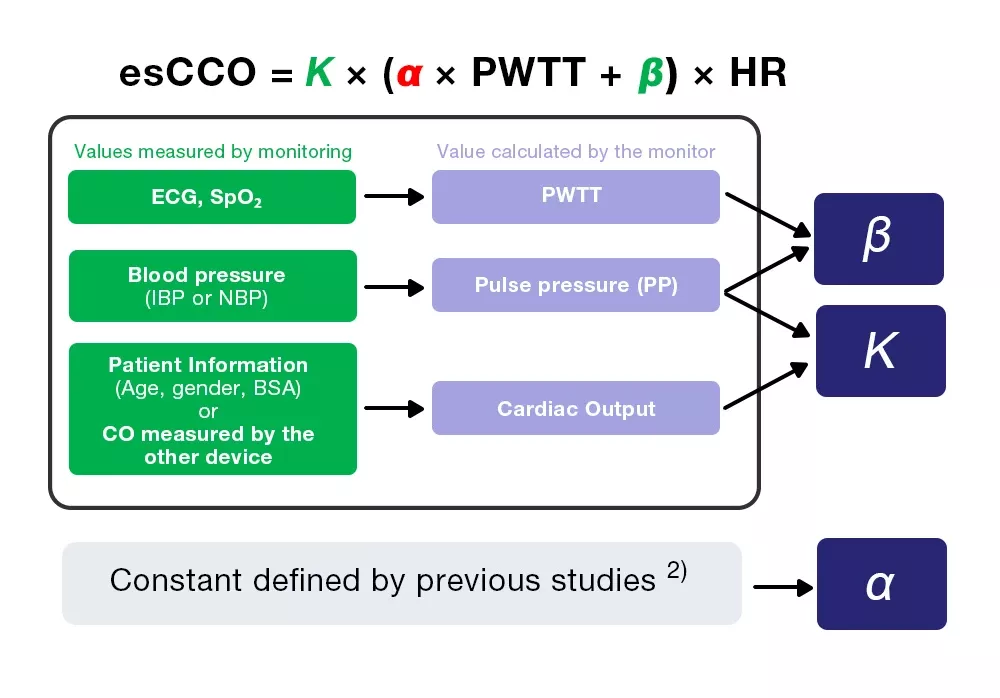
esCCO obtains cardiac output from equation (4), which includes three coefficients (K, α and β).
esCCO = K × (α ×PWTT +β) ×HR (4)
Of the three coefficients, α is a constant (2) which is obtained from previous studies. K and β are determined by inputting the three values (PWTT, PP and CO) calculated by monitoring during calibration.
However, CO for calibration is obtained from patient information, which enables non-invasive measurement, one of esCCO’s greatest features.
Reference
1) Sugo Y, UkawaT, Takeda S, Ishihara H, Kazama T, Takeda J. 2010. A Novel ContinuousCardiac Output Monitor Based on Pulse Wave Transit Time. Conf Proc IEEE Eng MedBiol Soc. 2010: 2853-6.
2) Ishihara H, Okawa H, Tanabe K, Tsubo T, Sugo Y, Akiyama T, Takeda S. A New Non-Invasive Continuous Cardiac Output Trend Solely Utilizing Routine Cardiovascular Monitors. J Clin Monit, 2004; 18: 313–320.
Evidence based performance
In 2004, we reported that esCCO has a high correlation with Continuous Cardiac Output (CCO).
As we performed several clinical tests, the following report was made on accuracy and responsiveness, which are the key points of measurement performance.
Measurement Accuracy
In 2009, the efficacy of esCCO in practical application was evaluated in a multicenter study at 7 facilities in Japan and the results of the study were reported in a paper in 2012.
Multicenter Study Verifying a Method of Noninvasive Continuous Cardiac Output Measurement Using Pulse Wave Transit Time: A Comparison with Intermittent Bolus Thermodilution Cardiac Output
Authors: Yamada T, Tsutsui M, Sugo Y, Sato T, Akazawa T, Sato N, Yamashita K, Ishihara H, Takeda J. Reference: Anesth Analg 2012;115:82-6. July 2012, Vol.115, No.1.
Background
Many technologies have been developed for less invasive cardiac output monitoring. esCCO is one of the technologies that determine the cardiac output using PWTT. When used together with basic monitoring of ECG, SpO2, blood pressure using ECG electrodes, SpO2 probes, and cuffs, esCCO may be applicable for clinical circulatory monitoring for all patients, including low-risk patients. The efficacy of esCCO was evaluated using PWTT in a multi-institutional joint study.
Method
The study compared esCCO and cardiac output measured by intermittent bolus thermodilution (ICO) for 213 cases at 7 facilities in Japan (139 cases in ICU, 74 cases in OR). ECG, SpO2 and invasive blood pressure were measured for all patients, and esCCO was calibrated once. For ICO measurement, cardiac output was measured once a day for ICU patients and hourly for OR patients, and just prior to removal of the pulmonary artery catheter for both ICU and OR patients.
ICO and esCCO were compared by correlation analysis and Bland-Altman analysis, and changes in bias over time were also evaluated.
Result
Correlation between esCCO and ICO
A total of 587 measurement points were obtained from 213 patients. The patient demographics are shown in Table 1.
| n | Age | Gender (M/F) | Height (cm) | Weight (kg) | BSA (㎡) | |
|---|---|---|---|---|---|---|
| Total | 213 | 65.1 ± 12.7 | 142/71 | 160.0 ±10.3 | 59.2 ±12.5 | 1.61 ±0.20 |
Table 1. Patient demographics
Correlation between esCCO and ICO was r = 0.79 (p<0.01) and bias ± precision was 0.13 ± 1.15 (L/min), which suggests that esCCO has a good measurement accuracy equivalent to ICO (Figure 4).
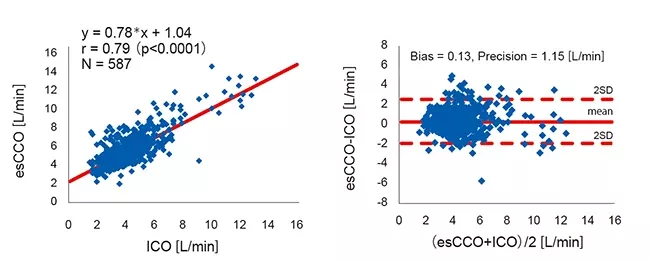
The 95% confidence interval for mean bias between esCCO and ICO was 0.04 to 0.22. This was within the range of ± 0.3 (L/min) which is considered acceptable for clinical use3.
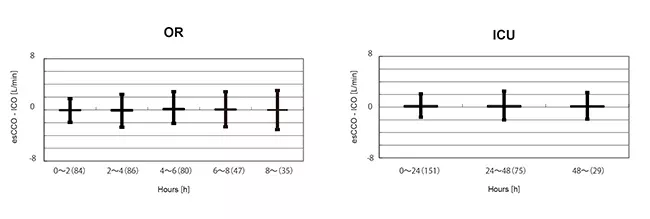
To evaluate changes in bias over time, the data for the period after calibration in the OR group were divided into 5 intervals of 2 hours each. A significant difference was not found in the bias of these 5 intervals. (Welch's ANOVA p = 0.07)
Also, in the ICU group, the data after calibration were divided into 3 intervals of 24 hours each. A significant difference was not found in the bias of these 3 intervals. (Repeated-measures ANOVA P = 0.781) (Figure 5).
Summary
There was a strong correlation between esCCO and ICO and the bias was small. Bias change over time was also small.
Responsiveness
A comparison was reported in 2015 with a measurement method based on the invasive blood pressure waveform (APCO), which is widely used in many facilities to measure cardiac output.
Cardiac output by intermittent bolus thermodilution (ICO) was used as the basis for the comparison and the comparison of changes over time confirmed that the responsiveness was comparable to APCO.
Comparison of the ability of two continuous cardiac output monitors to measure trends in cardiac output: estimated continuous cardiac output measured by modified pulse wave transit time and an arterial pulse contour-based cardiac output device
Authors: Terada T, Oiwa A, Maemura Y, Robert S, Kessoku S, Ochiai R.Reference: J Clin Monit Comput. 2015 Sep 14.
Background
Kidney transplantation is associated with numerous cardiovascular abnormalities, increasing cardiac output and decreasing arterial pressure and vascular resistance. Therefore, perioperative monitoring of these parameters is crucial for kidney transplantation patients.
This study compared esCCO, cardiac output measured by intermittent bolus thermodilution (ICO) and the arterial pressure-based cardiac output (APCO) which is based on observation of the arterial blood pressure waveform.
Method
Adult patients scheduled for kidney transplantation and able to provide informed consent were enrolled in the evaluation at Toho University Omori Medical Center.
ECG, SpO2 and invasive blood pressure were measured in all patients.
ICO, esCCO and APCO were measured at the following 4 times: after induction of anesthesia, before suturing of the transplanted kidney begins, before arterial clamping (arterial revascularization), and at the end of surgery.
The results for each algorithm were compared using correlation analysis, Bland and Altman analysis and Polar Plot analysis
Result
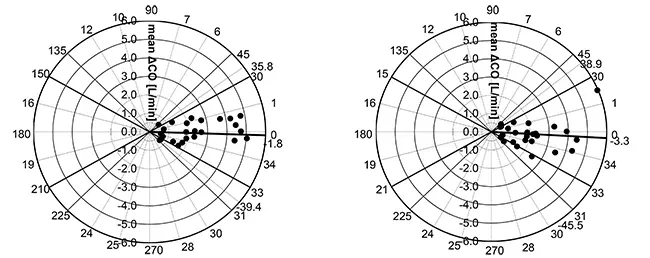
Mean angular bias of esCCO and ICO was -1.8°, radial limits of agreement were ± 37.6°. (Figure 6. Left)
Mean angular bias of APCO and ICO was -3.3°, radial limits of agreement were ± 42.2°. (Figure 6. Right).
Thus, we can say that the correlation, bias, and trending ability between esCCO and ICO are comparable to those between APCO and ICO.
A case report (Figure 7) shows that the trending ability of esCCO is comparable with APCO.
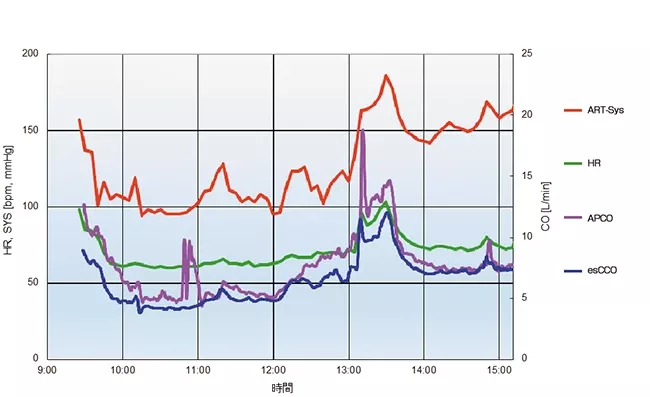
31 years old male with height of 180 cm and weight of 93.8 kg.
The measured values of APCO and esCCO, respectively, were 6.5 L/min and 4.7 L/min after the induction of anesthesia, 7.3 L/min and 6.5 L/min before the start of suturing the grafted kidney, 14.3 L/min and 12.0 L/min before clamping of the artery (artery reperfusion) after the fluid challenge, and 7.4 L/min and 7.4 L/min at the end of the surgery.
Summary
The trending ability of esCCO is clinically acceptable and comparable to arterial pressure waveform analysis.
Reference
1 Ishihara et al. 2004. A new non-invasive continuous cardiac output trend solely utilizing routine cardiovascular monitors. J Clin Monit, Dec, 18: 313-320.
2 Lawrence C. Siegel, Maeve M. Hennessy, Ronald G. Pearl. 1996. Delayed Time Response of the Continuous Cardiac Output Pulmonary Artery Catheter. Anesth Analg
FAQ
esCCO is a new technology to determine the cardiac output continuously and non-invasively. This is a FAQ page for the most frequently asked questions we receive.
Can children and neonates be measured?
Yes but it is not recommended as we do not have clinical evidence.
- esCCO measurement has not been validated in neonates. The vascular characteristics of neonates are generally different from those of adults, so the wave propagation characteristics are affected.
- For children, when performing CO calibration using patient information, because pediatric data is not included in the data when determining the regression equation, the esCCO value may be overestimated.
Can a pulse oximeter probe be attached to a toe or ear?
Yes, but it is not recommended as we do not have clinical evidence.
Since PWTT depends on the length of the blood vessel and its compliance, PWTT may vary depending on the attachment site. The current esCCO is evaluated primarily on the fingers and have not been validated on toes or ears.
Pay attention if the probe attachment site is changed from a finger to a toe or an ear during esCCO measurement because PWTT changes and the value of esCCO will significantly change.
When should the calibration be done?
Calibration after induction of anesthesia is recommended.
Evaluating the effectiveness of esCCO is confirmed by a comparison with invasive CO measurements initiated primarily after induction of anesthesia.
Before induction of anesthesia, the patient is nervous, their blood pressure is high and their heart rate is fast, so calibration in this situation tends to result in excessive esCCO values.
Also, during induction of anesthesia, the probe tends to move due to breathing and body movements, which may prevent stable detection of the pulse wave, and calibration may be difficult.
Blood pressure and heart rate are relatively stable after induction of anesthesia, so PWTT is stable, making calibration easier.
When is recalibration necessary?
We recommend recalibrating when the value of esCCO changes significantly, for example, in the following situations where the correlation between PWTT and SV changes significantly from the time of calibration.
ECG: changed in ECG induction, QRS shape changed significantly.
Others: when the attachment site of heart rate and pulse wave sensors is changed because of a change in the patient's body position (face-up position to lateral position) or after a cardiopulmonary bypass (CPB) or heart valve replacement.
When esCCO is inapplicable?
The following situations and cases are considered inapplicable.
Heart surgery: esCCO measures cardiac output based on PWTT. With a diseased heart, the situation may occur where stable PWTT cannot be obtained, or PWTT cannot be measured because of stress to the heart of macrovascular system.
Cases where electrocautery is frequently used: noise from electrocautery affects ECG, making it impossible to measure PWTT.
Other limitations, such as the fact that pacing is not allowed, are contained in the operating manuals.
Material Downloads―esCCO
Learn more

Experience with esCCO in Surgery in Elderly Patients
Hemodynamic Management Using esCCO
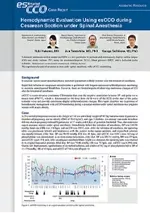
Hemodynamic Evaluation Using esCCO during Cesarean Section under Spinal Anesthesia

Can Estimated Continuous Cardiac Output Be Used in the Same Manner as Arterial Pressure-Based Cardiac Output?
Continuous Cardiac Output from ECG and SpO2

Non-Invasive Hemodynamics Monitoring
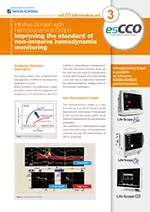
Improving the standard of non-invasive hemodynamic monitoring

Hemodynamics Graph for GDT

Hemodynamic Management Using Estimated Cardiac Output (esCCO)
Anesthesia Management Using Estimated Continuous Cardiac Output (esCCO)

Comparison of trend performance of esCCOand APCO in kidney transplantation

esCCO Performance Report